Virtual session
Take a virtual tour of CatchIS
CatchIS is based on over 20 years of research and development at Cranfield University and is used widely by industry and regulator alike. These pages provide an idea of how the CatchIS software tool operates in use.
System framework
The CatchIS platform
CatchIS is a modern software tool which operates under the Microsoft Windows operating system, working well on a laptop or deskside PC. The application is centred around the industry-standard ESRI ArcGIS tool. CatchIS also utilises Microsoft Excel to manage certain of the graphs and datasets it produces and exports.
CatchIS summary
CatchIS in use
CatchIS provides a powerful suite of tools and models to assist in the strategic and operational management of water resources at the catchment scale, and to provide an informed and rational response to the Water Framework Directive and to the development of Water Safety Plans. The capabilities of CatchIS can assist in understanding and characterizing catchment risks, as well as in developing strategies for mitigating these risks, such as alternative application regimes. CatchIS can also assist in managing the environmental risk to buried infrastructure and assets, playing a key role in the Asset Management Planning (AMP) cycle. Overall CatchIS provides a set of functionality which maximizes the organisational investment in the unique suite of environmental data-sets offered by Cranfield University and its partners.
Datasets overview
CatchIS draws upon a wide range of data resources in its operations. The available data-sets provided currently include:
- Source Protection Zones (Environment Agency);
- Local Authority Boundaries;
- District Health Authority Boundaries;
- 1:250,000 topographical backdrop raster data;
- Enhanced 1:50,000 topographical backdrop raster data;
- Water Quality Zone Boundaries.
Key spatial datasets
Data provision in CatchIS
Thematic datasets are accessed via the ‘Data’ menu.

The data layers are useful for presentational purposes and for interrogating model results:
- Soil data (soil association, soil runoff potential, soil leaching potential);
- Agro-Climatic data (field capacity days - fcd, excess winter rain - xwr, return to field capacity - rfc);
- Landuse data - from ADAS UK Ltd;
- Topological Raster backdrop data - 250k/50k and toggle for switching on and off on display. In fact, any raster backdrop can be used - but we often use the OS Landranger datasets.
Soils datasets from LandIS
Digital soils information from NSRI

The Cranfield Soil and Agrifood Institute (CSAI) incorporates the former National Soil Resources Institute (NSRI), and Soil Survey and Land Research Centre (SSLRC) and, as a result, maintains all the published and unpublished paper soil reports and maps for England and Wales. CSAI market and lease a wide body of digital soil information, comprising the following principal data sets:
- Vector and gridded vector versions of the 1:250,000 scale National Soil Map (NATMAP) including the simplified Soilscapes version;
- The National Soil Inventory of data on soils and topsoil chemistry;
- Representative values or a range of properties and derived functional values for soil series;
- Soil profile descriptions, a proportion of which have accompanying analytical data.
All these data sets are held in the Cranfield's Land Information System, or LandIS. This is a relational database that is maintained by CSAI staff.
Agroclimatic datasets from LandIS
Digital climatic information from NSRI
CatchIS draws on a series of derived gridded agro-climatic variables for England and Wales (Jones and Thomasson, 1985). These datasets are held in Cranfield's Land Information System, or LandIS. These data were generated using long term historical datasets to characterise agroclimatic parameters. Parameters used in CatchIS include the climatic assessment of soil wetness (FCD) when excess rainfall is expected to induce runoff, the amount of rainfall during this period (XWR), the annual amount of rainfall available for leaching (AAHER) and the average annual rainfall (AAR).
All these data sets are held in the Cranfield's Land Information System, or LandIS. This is a relational database that is maintained by CSAI staff.
Pesticide usage data
Improving the predictive capacity of CatchIS
CatchIS is able to utilise a series of unique datasets from ADAS which substantially improve the predictive nature of the risk modelling, using a forecast of pesticide usage and land use characteristics on a catchment basis over the coming year. This dataset can be updated bi-annually and can have a spatial grid resolution of 1km x 1km on the ground. Examples are presented below to provide an indication of the nature of these datasets.

This information, of critical importance to the catchment manager, has been developed using two unique data sources and combined using GIS manipulation:
- ADAS 1 km2 agricultural census data;
- Local crop rotations and pesticide usage data from ADAS experts.
The 1 km2 Agricultural Census Data represents a distribution of all crops reported in the census and is developed from Defra's highest resolution data, and supplemented by other datasets (including the CEH Landcover and Ordnance Survey Vector mapping).
ADAS' expertise builds upon this data through the use of local 'field walkers' and agronomists. This provides:

- Pesticide usage statistics by catchment;
- Local crop rotations by catchment (to augment the ADAS 1 km2 agricultural census);
- 6-monthly updates to account for inter-annual variation.
By combining these data sources together and applying ADAS' unique expertise, CatchIS users benefit from:
- Agricultural Census data modified using local rotations;
- Distribution of the catchment scale pesticide usage statistics over the modified 1 km2 census data;
- Combination carried out in GIS providing mapped output.

Database manager
Data organisation and management
The database manager is accessed via the Tools menu.

The database manager is used to oversee the crop/compound combination datasets
This option allows the user to manage the various pesticide and crop combination datasets and to import new compound definitions.
Menu overview
Controlling a CatchIS session
CatchIS uses a powerful Mouse-driven Graphical User Interface (for instance to select an area, select a model to run and then to inspect and report on the results).

- CatchIS can use your company's GIS data and topographical vector and raster data (e.g. Ordnance Survey Landranger tiles) for location and presentational purposes. Company GIS boundaries such as WSZ, DMA etc. can be used to define the area of interest for modelling.
- CatchIS contains the unique soil and environmental datasets of Cranfield University's National Soil Resources Institute (NSRI) and ADAS.
- CatchIS can produce a broad range of visual reports, plots and analyses relating to the model results and predictions. Data is output to standard office software such as Microsoft Excel.
- The CatchIS framework is modular - it currently holds eight risk assessment/vulnerability models and related scenarios.
- CatchIS has a simple to use Wizard interface to guide you through the process of selecting and running models if you are not used to using the system.
Help system
Finding help
CatchIS offers a strong online user-support help text and manual. Cranfield offer a range of training and tuition options, both as part of the core package and where any customised training requirements exist.

Area of interest
Selecting the focus for the model runs
The first requirement in CatchIS is to define an area of interest (AOI) which is used subsequently for analysis, reporting and statistical purposes.

CatchIS allows a wide range of AOI selections to be made - ranging from company boundaries to environmental boundaries, and from regulator boundaries to user-defined boundaries.
Selections via ‘Area of Interest’ menu, pointing and direct queries.
Pesticide vulnerability modelling
Determining fate and behaviour of organic compounds
The CatchIS system employs a comprehensive suite of simulation screening models aimed at assessing the vulnerability of both surface and groundwaters to contamination by diffusely applied contaminants such as pesticides. The flow chart shown below provides an indication of which model you might wish to run based on the management issues being considered.
Typically CatchIS users will run a sequence of modelling approaches giving first a broad characterisation of the catchment, followed by more specific modelling focusing in on specific problem areas.The range of modelling choices in CatchIS.
The models are selected from a simple menu interface:

Top 10 pesticides
CatchIS has a suite of models available. The first allows you a predictive look at the likely top ten pesticides that will appear over the coming season in any catchment. Predictions are based on ADAS forecasts and can be selected either for Surface or Ground waters:


Surface water pesticides
Protecting the surface water source
The model SWATCATCH computes time series flows and concentrations that can be expected at the catchment outlet/abstraction point following use of a specific compound on a specific crop. The results are compiled into a new Excel spreadsheet.

You can also consider the likelihood of exceeding a given threshold. The Threshold spreadsheet in Excel may be used to give a probability of exceedance as a percentage given a user specified threshold concentration.


Surface water hotspots
Identification of spatial risk
The surface water hotspots model allows you to identify hotspots within the catchment (or AOI) which are particularly vulnerable to a particular compound. The compound can either be applied everywhere, irrespective of cropping or land use (vulnerability potential), or utilise the actual landcover data from ADAS UK Ltd. to identify crop-specific hot spots.


Ground water pesticides
Protecting the ground water abstraction sources
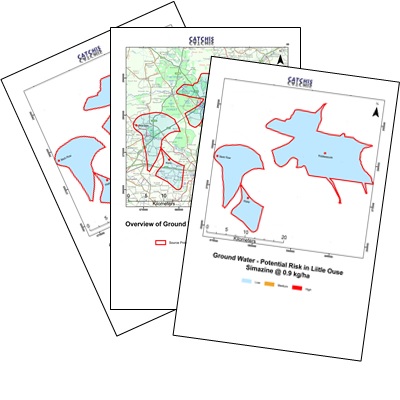
The pesticide groundwater model, GWAT, predicts concentrations of pesticides impacting on abstraction boreholes following use of a specific compound on a specific crop. Results are presented as a 'risk assessment' based on the likelihood of concentrations being above 0.1 µg l-1, taking into account variability in pesticide characteristics and the spatial distribution of soils and crops across the source protection zone.


Ground water hotspots
Identification of spatial risk
The ground water hotspots model allows you to identify hotspots within any area of interest (AOI), which are particularly vulnerable to use of a particular compound on a specific crop. The model integrates predicted volumes of recharge and masses of compound leached (based on the target crop cover data from EDL) within a 2 km x 2 km grid and presents the results across the AOI.
Similarly, the groundwater hotspots model can be run for one or more AOIs (three adjacent sub-catchments as shown below).

Reports
CatchIS reporting capabilities
CatchIS contains a range of powerful reporting tools.

The surface water and ground water report options generates a report in Microsoft Word and as a PDF for the selected catchment or source protection zone uisng ADAS' Pesticide usage data for the spring and autumn seasons selected.
The report shows the top pesticides for both spring and autumn, and the provides more detailed model outputs for up to five high risk pesticides. Alongside the report, the option generates time series threshold Excel spreadsheets, gis layers and hotspots map images for the selected pesticides in the catchment.


Other elements
Completing CatchIS capabilities
CatchIS contains a range of other optional features which may prove of interest.
Climate change data
Future impacts on catchment management
This optional element allows the user to substitute the current climatic data that drives the models for future climate scenario data derived from the UKCIP02 emission scenarios (UK Climate Change Impacts Panel). This enables users to assess possible changes in water quality that may result from future climate change, although land use is assumed to remain the same.

LEACS - leakage and shrinkage
Underground Asset Management Planning (AMP)
Another optional element of CatchIS is the LEACS 'Leakage and Corrosivity and Shrinkage' modelling suite, designed for operational AMP. This gives an assessment of ground conditions that could affect buried assets. There are two basic components, corrosivity and ground heave and for the former, both ferrous iron and zinc modules exist.