Since 2010 the University has been driving down carbon emissions and by 2020/21 had achieved a 42% reduction in scope 1 and 2 emissions compared with a 2005 baseline. This is significant progress which was driven by our investment in renewable energy, energy efficiency and behaviour change initiatives.
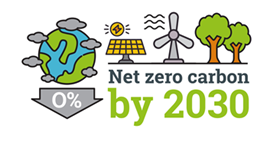
In 2020, the University committed to a set of ambitious new targets, including Net Zero Carbon by 2030. This covers all University activities and includes scope 3 emissions. For the latest progress, including KPIs, please see our latest annual report.
Download Carbon Management Plan
Download the Streamlined Energy and Carbon Report
Download our Energy Policy Statement

Above: Graph showing the amount of greenhouse gas emissions in tons of carbon dioxide equivalent scope 1 and 2, from 2005 to 2023. Graph shows a downwards decrease in emissions with time.
Note: Year 2005 runs from August 2005 to July 2006 etc.
|
Tons CO2 |
2019/20 |
2020/21 |
2021/22 |
2022/23 |
2023/24 |
|
Scope 1 |
8,343 |
9,277 |
7,252 |
6,769 |
6,998 |
|
Scope 2 |
1,599 |
1,613 |
2,357 |
2,763 |
2,073 |
|
Total |
9,942 |
10,890 |
9,609 |
9,532 |
9,071 |
Above: Table shows Scope 1 and 2 emissions over time in tCO2.
Scope 3 emissions
The measurement of scope 3 emissions relies largely on third party data based on spend and there is a lag in obtaining and verifying realistic information. As soon as figures are available this report will be updated. We are working to reduce our carbon emissions associated with business travel. For more information and to read our Sustainable Business Travel Plan, please see our sustainable travel and transport page.
